


BEYOND DELHI, UP’s Loni Officially Named World’s Most Polluted City in 2026.The 2025 World Air Quality Report, released on March 24, 2026, by IQAir, has sent shockwaves through the global community. For the eighth consecutive year, the findings highlight a deteriorating reality: 91% of nations now exceed the World Health Organization (WHO) annual safety limit for PM2.5.
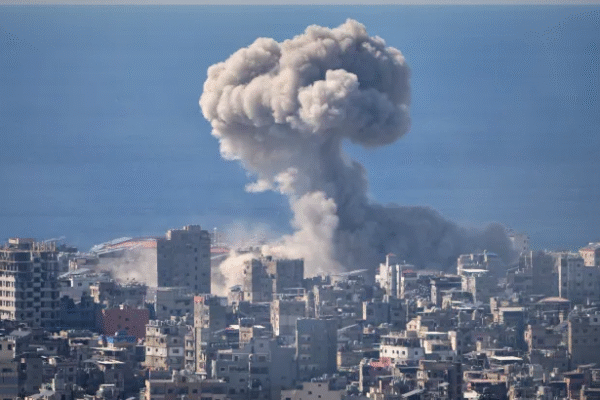
While the report confirms that global air quality is declining—driven by a combination of fossil fuel dependence and historic wildfires—it is South Asia, particularly India and Pakistan, that remains the epicenter of the crisis.
The Global Pollution Leaderboard: 2025-2026
The WHO’s recommended annual limit for PM2.5 is 5 µg/m³. However, the world’s most polluted cities are operating at levels more than 20 times this threshold.
| Global Rank | City | Country | Annual PM2.5 (µg/m³) | Times Over WHO Limit |
| 1st | Loni | India | 112.5 | 22.5x |
| 2nd | Hotan | China | 109.6 | 21.9x |
| 3rd | Byrnihat | India | 101.6 | 20.3x |
| 4th | Delhi | India | 99.6 | 19.9x |
| 5th | Faisalabad | Pakistan | 95.4 | 19.0x |
| 6th | Lahore | Pakistan | 94.2 | 18.8x |
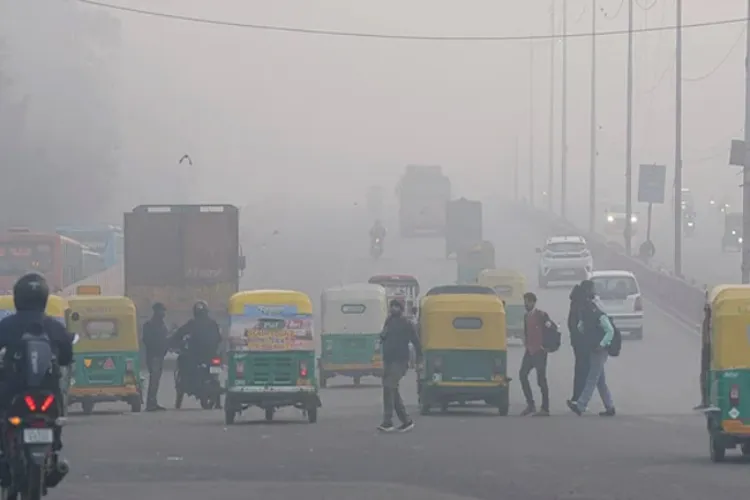
New Delhi remains the world’s most polluted capital city for the eighth year in a row, even though its annual average saw a slight 8% decline due to stricter local monitoring.
The State-Wise Crisis in India
India is currently the 6th most polluted country globally. While the Indo-Gangetic plain (UP, Bihar, Haryana, Delhi) remains the most hazardous, new data shows pollution “leakage” into previously cleaner states.
Air Quality and Cleanliness by State
| State | Most Polluted City (PM2.5) | Cleanliness Highlight (Swachh Survekshan) | Primary Issue |
| Uttar Pradesh | Loni (112.5) | Lucknow (Top 3 Cleanest) | Industrial emissions & garbage processing gaps |
| Bihar | Saharsa (186 AQI) | Patna (Bottom Tier) | Biomass burning & low municipal efficiency |
| Meghalaya | Byrnihat (101.6) | Shillong (Good AQI) | Unregulated industrial clusters in hill zones |
| West Bengal | Ula/Birnagar (85.3) | Kolkata (Poor Air) | Construction dust & transboundary haze |
| Madhya Pradesh | Bhopal (Moderate) | Indore (India’s Cleanest City) | Exemplary waste segregation at source |
| Maharashtra | Mumbai (Increasing) | Navi Mumbai (Top 3 Cleanest) | Coastal humidity trapping vehicular smog |
| Gujarat | Ahmedabad (Poor) | Surat (2nd Cleanest) | High industrial density vs. efficient cleaning |
| Haryana | Gurgaon (74.6) | Karnal (Improving) | Stubble burning & rapid urban construction |
The Role of Civic Senseand Municipal Accountability
The data reveals a stark contrast between a city’s air quality and its surface cleanliness. A city like Agra or Agartala might rank reasonably well in air quality, yet struggle with “dirtiness” on the ground due to poor municipal management.
- Administrative Corruption: In cities like Aligarh, the lack of functional waste treatment plants (like the stalled A to Z plant) often leads to illegal dumping. This waste eventually leaches into the ground or is burned, further contributing to toxic air.
- The “Indore” Model: The reason Indore has been the cleanest city for eight years is not just government spending, but a 90% waste segregation rate. When citizens take responsibility for separating plastic from organic waste, the municipal workload reduces significantly.
- WHO Health Warning: Fine particulate matter (PM2.5) is now linked directly to reduced IQ in children and a massive spike in cardiac cases among young adults in South Asia.
The Path Ahead
The 2026 report concludes that India is “a victim of its own success in monitoring.” Because India has expanded its network to 259 cities, it reveals more pollution than countries that do not monitor their air. However, knowing is only half the battle; the actual implementation of the National Clean Air Programme (NCAP) must move away from “road dust control” (which currently consumes 64% of the budget) and focus on industrial and waste-burning regulations.

Prerna Varshney is a journalist and social commentator with over five years of experience in health, gender, and policy reporting. Her work reflects a deep commitment to truth and empathy, simplifying complex issues for everyday readers.